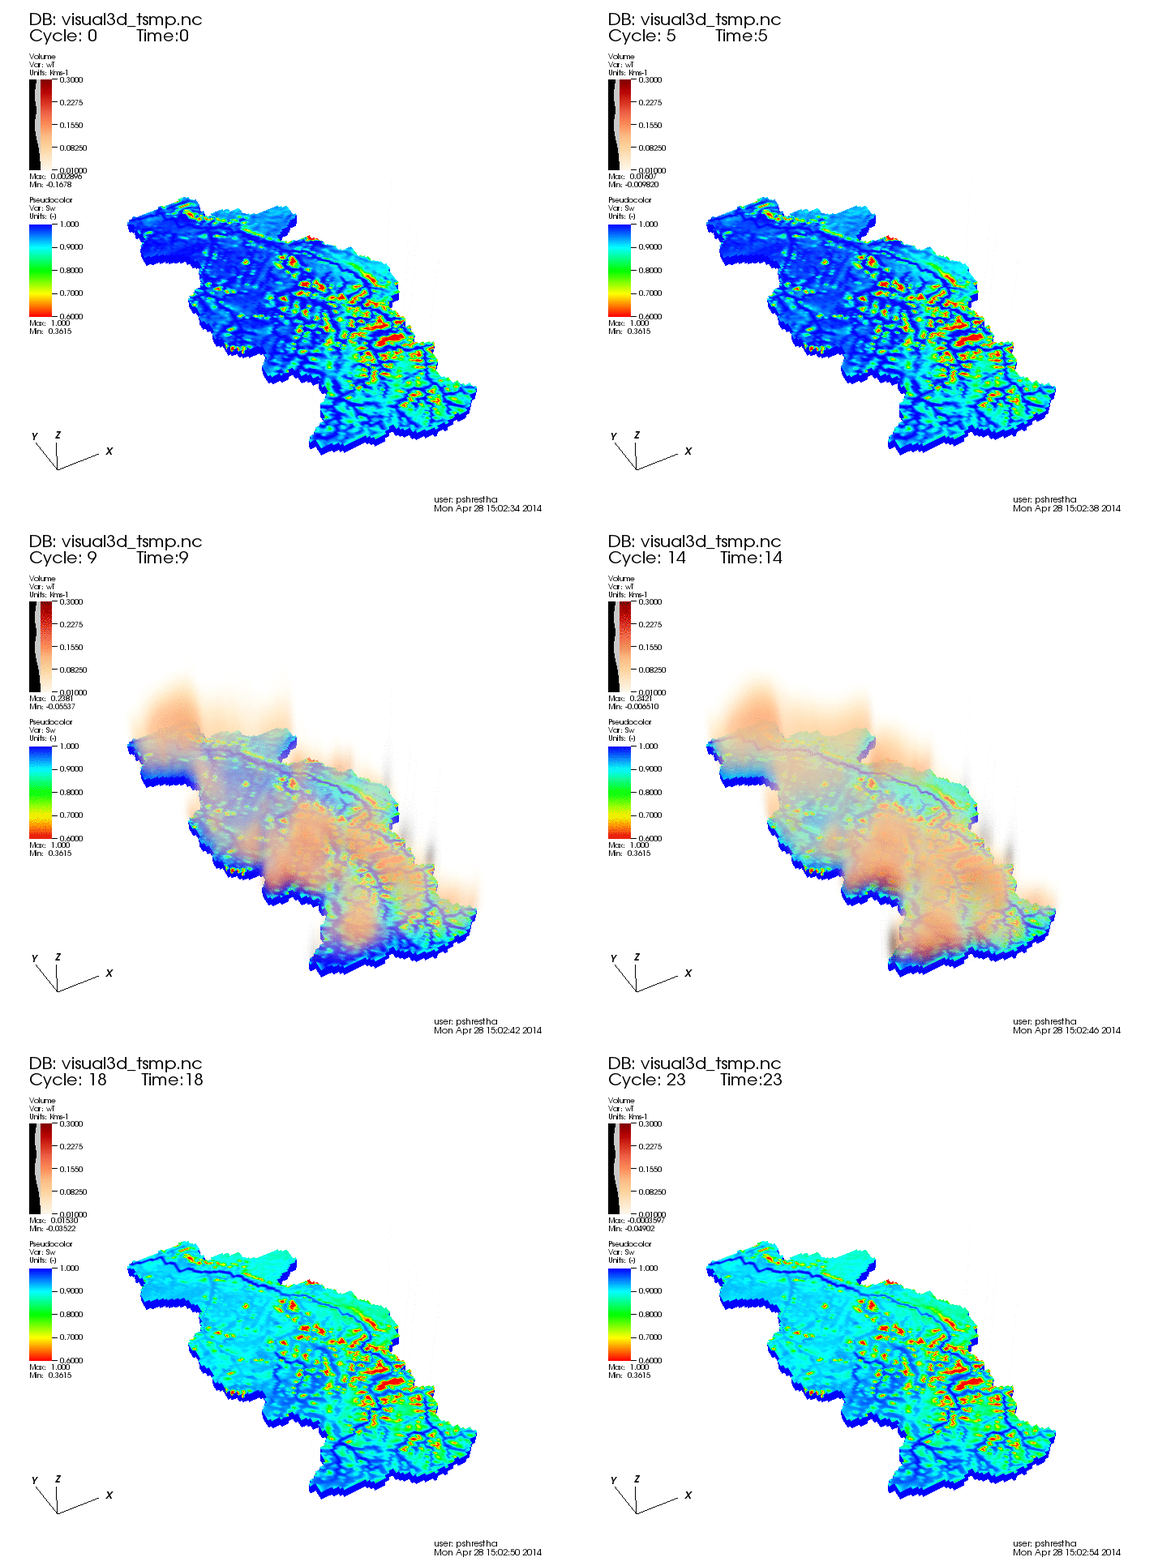
The animation shows the diurnal spatio-temporal evolution of soil moisture and turbulent eddy heat flux over the Rur catchment. Since, trees have lower albedo and higher roughness coefficients, they produce higher sensible heating compared to other landcover under moist soil condition, consistent with the simulated turbulent eddy heat flux.
The simulation was done using TerrSysMP and the turbulent eddy heat flux was estimated using flux gradient relationship and averaged over an hour (30 samples per hour).


